Surfaces and Contour Plots
Part 4: Graphs of Functions of Two Variables
The graph of a function z = f(x,y) is also the
graph of an equation in three variables and is therefore a surface. Since each
pair (x,y) in the domain determines a unique value of z,
the graph of a function must satisfy the "vertical line test" already
familiar from single-variable calculus. Some of the surfaces we have encountered
in the preceding sections are graphs of functions and some are not.
- Which (if any) of the Cartesian
coordinate surfaces x = c, y = c, and z = c
are graphs of functions? Explain.
- What familiar surface is the graph
of the function z = x2 + y2?
- Which (if any) of the following
quadric surfaces are graphs
of functions? Explain.
- Sphere, x2 + y2 + z2 = p2
- Elliptic paraboloid, z = 3x2 + y2
- Hyperbolic paraboloid, z = x2 - y2
- Hyperboloid of one sheet, x2 + y2 - z2 = 1
- Hyperboloid of two sheets, x2 - y2 - z2 = 1
- Which (if any) of the following
cylinders are graphs of functions?
Explain.
- Circular cylinder,
x2 + y2 =4
- Circular cylinder,
x2 + z2 =4
- Parabolic cylinder, y2 = z
- Parabolic cylinder, z2 = x
- Sinusoidal cylinder, y = sin(x)
- Sinusoidal cylinder, z = sin(x)
From
economics we have the important concept of a Cobb-Douglas
production
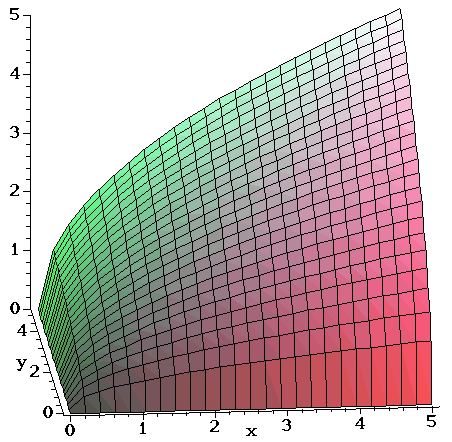
function, the simplest example of which is f(x,y) =  .
In economic terms, the function relates productivity to labor and capital. The
graph of this function for 0 < x < 2
and 0 < y < 2 is shown below.

- Make your own picture of the Cobb-Douglas
function f(x,y) =
 in your worksheet, and rotate it to view the surface from various angles.
- A more general form for Cobb-Douglas
functions is f(x,y) = xay1-a,
where 0 < a < 1. What value of a gives
the function in step 5? Vary a between 0 and 1, and redraw the surface.
What stays the same when you change a? What changes?
| CCP
Home | Materials | Multivariable
Calculus | Module Contents | Back
| Forward |
![]() .
In economic terms, the function relates productivity to labor and capital. The
graph of this function for 0 < x < 2
and 0 < y < 2 is shown below.
.
In economic terms, the function relates productivity to labor and capital. The
graph of this function for 0 < x < 2
and 0 < y < 2 is shown below.