Roulettes
Part 2: The Spirograph®

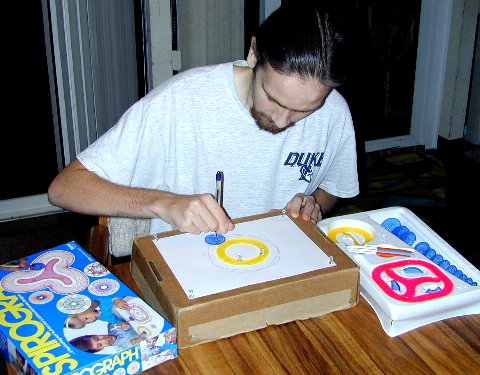
The picture above shows a student
making a drawing with a well-known toy, the Spirograph®.
We see a blue circle rolling around the outside of a yellow circle, and the
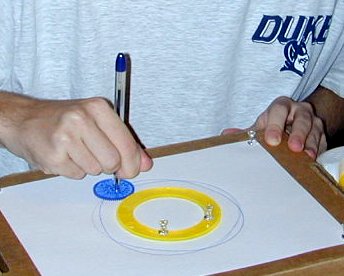
pen is placed through a hole interior to the blue circle. Here is a closeup
of the early stage of the drawing:

In this part of the
module we will use an online simulation of the Spirograph®
(a Java applet) to create roulettes, the technical name for a curve traced
out by a moving point on one circle rolling on another circle. The applet is
© 1997 by David P. Little.
To start the SpiroGraph applet in a new window, click here.
Then return to this page for further instructions.
- Draw the roulette with the given
values of a = 60, b = 60, and c = 60.
The resulting curve is called a cardioid (which means "heart-shaped").
Record your radii, drawing position, and answers to the following questions:
- How many times does the center
of the moving circle go around the fixed circle before the drawing point
returns to its starting position?
- How many “inner”
turning points are there on the curve, i.e., points at which the drawing
pen reaches its minimum distance from the center of the fixed circle?
- How many complete rotations
does the moving circle make as it travels once around the fixed circle?
(Your answer here should agree with what you found with two pennies in
Part 1.)
- Experiment by changing the value
of c, both larger and smaller. How are your answers to questions a.,
b., and c. in step 1 changed? What if c is negative? [Note: Most of
the roulettes you can generate in this way are not cardioids. Are there any
with c different from 60 that are cardioids?]
- Now use a = 60,
b = 40, and c = 40. Answer questions a.,
b., and c. from step 1 again. Record your answers.
- Continue to experiment with values
of b and c that are equal to each other but smaller than a.
(That is, keep the drawing point on the smaller circle.) The resulting curves
are called epicycloids. Find answers to questions a., b., and c. from
step 1 for at least three more cases.
- For the each of the choices of
radii a and b that you used in steps 3 and 4, choose a different
value of c. How do your answers to the questions change?
In the next part we use vector addition
to derive parametric formulas for the curves you have drawn here. You will have
at least two ways to check the correctness of your formulas:
- The ways in which the constants
a, b, and c enter into the formulas should confirm the
variety of behaviors you have observed.
- When your formulas are plotted
in your computer algebra system (with the same values of the constants a,
b, and c), they should produce the same curves you generated
in the applet.
|
CCP Home | Materials | Multivariable
Calculus | Module Contents | Back
| Forward |

