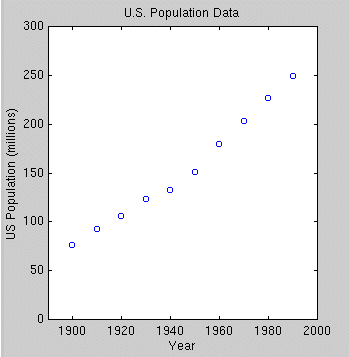
|
|
|
|
|
 |
||||||||||||||||||||||||||
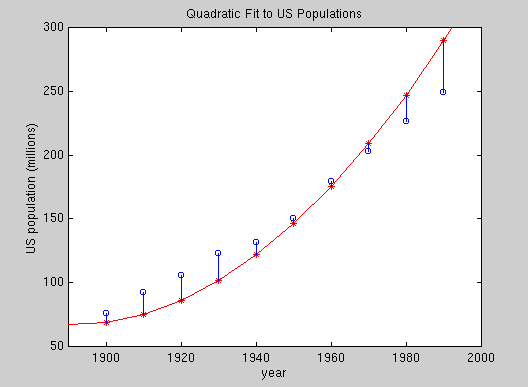
Our model function is a
quadratic of the form y = a + b t + c t2.
Below, we plot such a quadratic function, along with vertical line segments
indicating the deviations or residuals from the data points
to the corresponding points on the model curve. As in the "Least Squares"
module, our criterion for best fit is that the best choice of quadradic
curve should minimize the sum of the squares of the residuals --
hence the name "least squares."

Remark about notation: As in the "Least Squares" module, we will maintain a distinction between vectors and scalars by boldfacing vector names but not boldfacing scalars.
(T1,Y1), (T2,Y2), ..., (T10,Y10).
Explain why the quantity to be minimized is
[Y1 - (a + bT1+
cT12)]2 + [Y2 - (a+ bT2+
cT22)]2 + ...
+ [Y10 - (a
+ bT10+ cT102)]2.
and the set of vectors of the form
(a+ bT1+ cT12, a+ bT2+ cT22, ... , a + bT10+ cT102)T.
Let
t2 = (T12, T22, ..., T102)T
a 1 + b t + c t2
where a, b, and c are real
numbers.
where X is the matrix with
columns 1,
t, and t2 and v is the
solution vector (a, b, c)T.
Since p is the projection of y onto the subspace W, we know that y - p is othogonal to the entire subspace W, in particular to vectors 1, t, and t2. Explain why this orthogonality can be expressed as
XT(y - p) = 0.
Show that this implies that v must satisfy the matrix equation
XTXv = XTy.
This matrix equation consists
of three scalar equations in the three parameters a, b, and c of the best
fitting quadratic model. The equations are known as the normal
equations.
In your helper application
worksheet, you will find the vectors 1,
t, t2,
and y for the U.S. population data. Note that time is
measured in years since 1900. Form the matrix X and
solve the matrix form of the normal equations for the parameters a, b,
and c of the best fitting quadratic.
Plot the least squares quadradic
that you just found together with a scatter plot of the U.S. population
data. How good is the fit?
Compute the projection p
of y onto the subspace W and also compute y - p.
Explain the relationship between these vectors and features of your plot from the previous step.
One common measure of goodness of fit is the sum of the residuals, the least-squares function that we have minimized. Tell why this quantity can be computed as S = norm(y - p)2. Compute S for the quadratic fit you have found.
|
|