Go to CCP Homepage Go to Materials Page Go to Engineering Mathematics Materials Go to Table of Contents
Go Back One Page Go Forward One Page

Spring Motion

Part 1: The Undamped Spring

In this project we model the motion of a spring-mass system with and without damping.

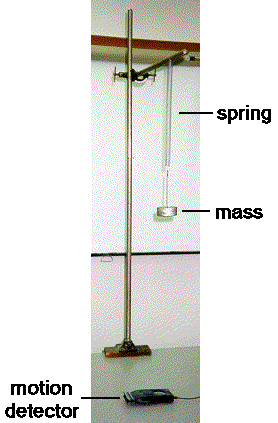
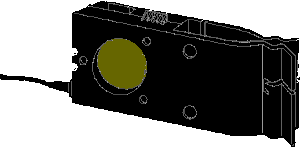
The figure at the right shows an experimental setup for tracking the motion of a mass hanging from a spring by using a motion detector, which might be attached to a calculator or computer. At the bottom of the figure, and enlarged below, is a Personal Science Laboratory (PSL) motion detector. The Calculator Based Laboratory (CBL) system has a similar motion detector.

If you have a facility for collecting your own spring-mass data, you can use that data in this module. If you do not have such a facility, you can use our data instead. We offer some suggestions for collecting your data.

  • Choose a spring-mass combination that will oscillate with little visible decay for 5 to 10 seconds.
  • Find your spring constant K by measuring with a meter stick the height to the mass hanger with no added mass, and again with a known mass added.*
  • Start each experiment by stretching the spring from its equilibrium position and then letting go. This means that initial velocity for each case will be zero.
  • The data values will be distances from the sensor to the bottom of the mass holder. In the worksheet we will center the data by subtracting the average position from each data value. This makes the initial displacement negative (below the mean).

Motion detector

PSL ultrasonic motion detector

  1. Enter in your worksheet the number n of data points, the time step dt between data points, the spring constant K, and the total mass (hanger and added mass) m. Then enter and graph the data -- either yours or ours.

  2. Our model for the undamped spring is
  3. with y(0) = y0 and y'(0) = 0. Determine an appropriate value for y0, and enter it. Then enter your model formula for the solution Y(t). Use the symbols K and m in your formula for Y(t).

  4. Plot the data and your model function together. Make any changes in the model function that seem necessary.

  5. How well does the model function approximate the data? What might account for differences between the data and the model function?

* We will use capital K for the spring constant throughout this module because lower case k is used in the worksheet for indexing information.

Go to CCP Homepage Go to Materials Page Go to Engineering Mathematics Materials Go to Table of Contents
Go Back One Page Go Forward One Page


modules at math.duke.edu Copyright CCP and the author(s), 1998-2000