|
|
|
|
|
|
Part 3: Accumulation and Area
In the preceding part, you calculated sums of the form
N'(p1) Delta-p1 + N'(p2) Delta-p2 + ... + N'(pn) Delta-pn.
That is, each term of the sum was a rate times a run, where the rate function N' (or dN/dp) was approximated by a difference quotient, and the corresponding Delta-p was the difference between consecutive diameters p.
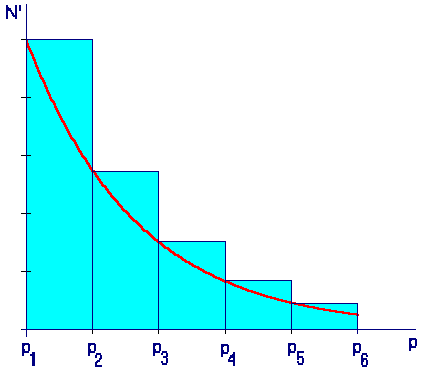
Now let's interpret that sum geometrically. If we exaggerate the shape of the graph of N' a little -- so we can actually see it -- and pretend there were only five terms in the sum instead of 26 or 22, then we see that we have summed the areas of the rectangles in the following picture. (In this picture we are also pretending that the distances between consecutive values of p are all the same -- which was not the case with our particulate data.) The graph of N' is shown in red. The height of each rectangle is a value of N' at the left edge of the corresponding rectangle, so we call the sum of the rectangular areas a left-hand sum.

Our left-hand sum with five terms is a rather crude approximation the the area under the graph of N'. But if there were 26 terms -- or 260 -- we could have a very good approximation to an area with a curved boundary.
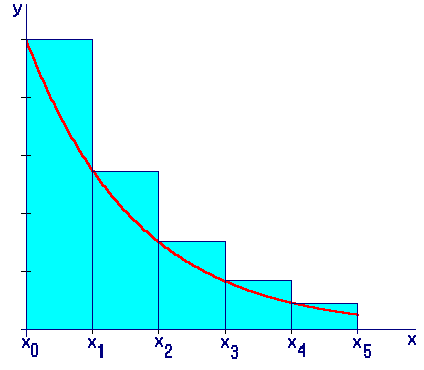
We're going to explore that idea now for the graph of an arbitrary function with positive values. We will replace the p-axis with an x-axis and the function N' with y = f(x). Also, we will start the numbering of the points of subdivision with 0 instead of 1. This is just a matter of convenience -- it makes the largest subscript match the number of subdivisions (instead of being one larger). Here is the same picture with those notational changes:

The sum of the rectangular areas is now
f(x0) Delta-x + f(x1) Delta-x + f(x2) Delta-x + f(x3) Delta-x + f(x4) Delta-x
where Delta-x is the common width of the intervals, xk+1 - xk, for each k.
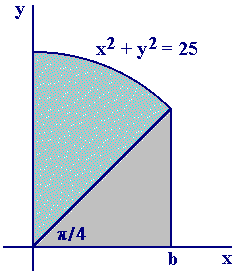
We turn our attention now to an area problem for which you can calculate an exact answer. We will explore the extent to which left-hand (and corresponding right-hand) sums approximate this known area. Here is the figure whose area we will study:

|
|
|
Last modified: November 18, 1997