Sinusoidal Graphs
Part 3:
Translations
Translation is a mathematical term for movement of an entire figure along a straight line. Thus, vertical translation of a graph means moving the graph up or down relative to the horizontal axis. Horizontal translation means moving the graph right or left relative to the vertical axis.
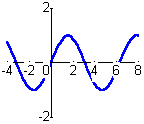
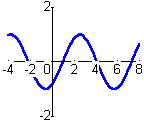
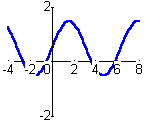
- The following figures show a graph of y = sin(t), together with horizontal and vertical translations of that graph. Which is which?
Vertical Translation
- Commands in your worksheet plot the graph of y = A + sin(t). What is the vertical translation of this graph from y = sin(t) for the given value of A?
- Vary A and replot. Describe the relationship between the value of A and the
vertical translation of the graph from y = sin(t). (If your helper application scales the graph automatically, play close attention to the scale on the y-axis.)
- Does changing A have any effect on the period of the function? In determining the period, what value do
you set sin(t) equal to when you solve for the peak location?
- Does changing A have any effect on the amplitude of the graph? Why or why not?
Horizontal Translation
- Next we plot two sinusoidal graphs together: The graph of y = sin(t) is in blue, and a horizontally translated graph y = sin(t - t0) is in red. Determine the amount and direction of the horizontal translation. (Note the minus sign in front of t0. This will
be important when you design your own equations.)
- The preceding question has more than one correct answer. What is another answer for a horizontal translation that will turn the blue graph into the red one? How are all possible answers related to t0?
- Vary t0, and determine the general relationship between t0 and horizontal
translation. What do you conclude?
- Plot the graphs of y = sin(t) and y = cos(t) together. Do you think you could horizontally
translate one of these graphs to get the other? If not, why not?
If so, figure out what the translation term t0 would be, and check
your answer by graphing your adjusted functions to see if they
match.
- Your next task is to create a sinusoidal graph with the following qualities:
- formula of the form y = A + B sin[C(t - t0)]
- period 4 pi
- amplitude 5
- maximum point at (0,6)
What values of A, B, C, t0 produce a function with these properties? Check by entering your values in the worksheet and graphing the function.
- Which one of your values (A, B, C, t0)
change if you use cosine instead of sine in the preceding question? State what your
cosine equation would be, and check it by inspecting its graph.


