|
|
|
|
|
|
Part 1: Background: Canadian Lynx and Snowshoe Hares
In the study of the dynamics of a single population, we typically take into consideration such factors as the "natural" growth rate and the "carrying capacity" of the environment. Mathematical ecology requires the study of populations that interact, thereby affecting each other's growth rates. In this module we study a very special case of such an interaction, in which there are exactly two species, one of which -- the predators -- eats the other -- the prey. Such pairs exist throughout nature:
To keep our model simple, we will make some assumptions that would be unrealistic in most of these predator-prey situations. Specifically, we will assume that

Photo source: Rudolfo's
Usenet Animal Pictures Gallery (link no longer exists)
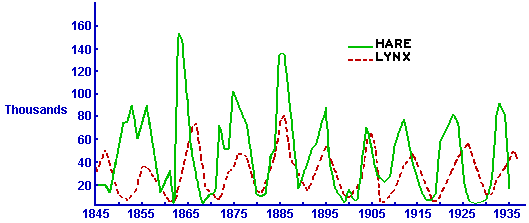
Very few such "pure" predator-prey interactions have been observed in nature, but there is a classical set of data on a pair of interacting populations that come close: the Canadian lynx and snowshoe hare pelt-trading records of the Hudson Bay Company over almost a century. The following figure (adapted from Odum, Fundamentals of Ecology, Saunders, 1953) shows a plot of that data.

To a first approximation, there was apparently nothing keeping the hare population in check other than predation by lynx, and the lynx depended entirely on hares for food. To be sure, trapping for pelts removed large numbers of both species from the populations -- otherwise we would have no data -- but these numbers were quite small in comparison to the total populations, so trapping was not a significant factor in determining the size of either population. On the other hand, it is reasonable to assume that the success of trapping each species was roughly proportional to the numbers of that species in the wild at any given time. Thus, the Hudson Bay data give us a reasonable picture of predator-prey interaction over an extended period of time. The dominant feature of this picture is the oscillating behavior of both populations.
To be candid, things are never as simple in nature as we would like to assume in our models. In areas of Canada where lynx died out completely, there is evidence that the snowshoe hare population continued to oscillate -- which suggests that lynx were not the only effective predator for hares. However, we will ignore that in our subsequent development.
|
|
|
| modules at math.duke.edu | Copyright CCP and the author(s), 1998, 1999 |