
In this module we examine solutions
to a simple second-order linear partial differential equation -- the one-dimensional
heat equation -- which models the flow of heat in a rod that is insulated
everywhere except at the two ends. Solutions of this equation are functions
of two variables: position along the rod and time. The "one-dimensional"
in the description of the differential equation refers to the fact that we are
considering only one spatial dimension.
Imagine a thin rod that is given an initial temperature distribution, then insulated
on the sides. The ends of the rod are kept at the same fixed temperature --
e.g., suppose at the start of the experiment, both ends are immediately plunged
into ice water. We are interested in how the temperatures along the rod vary
with time. Suppose that the rod has a length L (in meters), and we establish
a coordinate system along the rod as shown here.
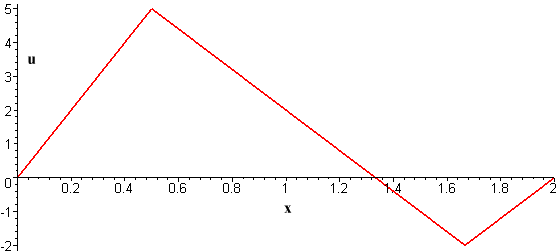
Let u(x,t) represent the temperature at the point x meters along the rod at time t (in seconds). We start with an initial temperature distribution u(x,0) = f(x) such as the one represented by the following graph (with L = 2 meters).
The partial differential equation
ut = a2 uxx
is used to model one-dimensional temperature evolution. We will not discuss the derivation of this equation here. The most important features of this equation are the second spatial derivative uxx and the first derivative with respect to time, ut. The positive constant a2 represents the thermal diffusivity of the rod. It depends on the thermal conductivity of the material composing the rod, the density of the rod, and the specific heat of the rod.
Typical values for the diffusivity constant are given in the table below (from Boyce and DiPrima, Elementary Differential Equations and Boundary Value Problems, 6th ed.)
| Material | a2 |
| Silver | 1.71 |
| Copper | 1.14 |
| Aluminum | 0.86 |
| Cast Iron | 0.12 |
| Granite | 0.011 |
| Brick | 0.0038 |
| Water | 0.00144 |
The function u(x,t) that models heat flow should satisfy the partial differential equation. However, in addition, we expect it to satisfy two other conditions. First, we fix the temperature at the two ends of the rod, i.e., we specify u(0,t) and u(L,t). In our sample problem, we will assume that both ends are kept at 0 degrees Celsius:
u(0,t) = u(L,t) = 0 for all t > 0.
This is called a boundary
condition since it is imposed on the values of the desired function
at the boundaries of the spatial domain.
The remaining condition represents the initial temperature distribution
u(x,0) = f(x),
where f(x) is the temperature at position x at time t=0. All together, the model function u(x,t) that we seek should satisfy
ut = a2 uxx
u(0,t) = u(L,t) = 0 for all t > 0
u(x,0) = f(x).
In this module we are not concerned with finding symbolic descriptions of the solutions of such problems. Rather, we will look graphically at the solutions to see

* Adapted from Introduction to the One-Dimensional Heat Equation by David Ambrose and Lang Moore, Duke University, © CCP and the authors, 1998